1. Introduction
† Abbreviations used: BLAST, basic local alignment search tool; MSP, maximal segment pair; bp, base-pair(s).
2. Methods
(a) The maximal segment pair measure
Sequence similarity measures generally can be classified as either global or local. Global similarity algorithms optimize the overall alignment of two sequences, which may include large stretches of low similarity (Needleman & Wunsch, 1970). Local similarity algorithms seek only relatively conserved subsequences, and a single comparison may yield several distinct subsequence alignments; unconserved regions do not contribute to the measure of similarity (Smith & Waterman, 1981; Goad & Kanehisa, 1982; Sellers, 1984). Local similarity measures are generally preferred for database searches, where cDNAs may be compared with partially sequenced genes, and where distantly related proteins may share only isolated regions of similarity, e.g. in the vicinity of an active site.
Many similarity measures, including the one we employ, begin with a matrix of similarity scores for all possible pairs of residues. Identities and conservative replacements have positive scores, while unlikely replacements have negative scores. For amino acid sequence comparisons we generally use the PAM-120 matrix (a variation of that of Dayhoff et al., 1978), while for DNA sequence comparisons we score identities +5, and mismatches −4; other scores are of course possible. A sequence segment is a contiguous stretch of residues of any length, and the similarity score for two aligned segments of the same length is the sum of the similarity values for each pair of aligned residues.
Given these rules, we define a maximal segment pair (MSP) to be the highest scoring pair of identical length segments chosen from 2 sequences. The boundaries of an MSP are chosen to maximize its score, so an MSP may be of any length. The MSP score, which BLAST heuristically attempts to calculate, provides a measure of local similarity for any pair of sequences. A molecular biologist, however, may be interested in all conserved regions shared by 2 proteins, not only in their highest scoring pair. We therefore define a segment pair to be locally maximal if its score cannot be improved either by extending or by shortening both segments (Sellers, 1984). BLAST can seek all locally maximal segment pairs with scores above some cutoff.
Like many other similarity measures, the MSP score for 2 sequences may be computed in time proportional to the product of their lengths using a simple dynamic programming algorithm. An important advantage of the MSP measure is that recent mathematical results allow the statistical significance of MSP scores to be estimated under an appropriate random sequence model (Karlin & Altschul, 1990; Karlin et al., 1990). Furthermore, for any particular scoring matrix (e.g. PAM-120) one can estimate the frequencies of paired residues in maximal segments. This tractability to mathematical analysis is a crucial feature of the BLAST algorithm.
(b) Rapid approximation of MSP scores
In searching a database of thousands of sequences, generally only a handful, if any, will be homologous to the query sequence. The scientist is therefore interested in identifying only those sequence entries with MSP scores over some cutoff score S. These sequences include those sharing highly significant similarity with the query as well as some sequences with borderline scores. This latter set of sequences may include high scoring random matches as well as sequences distantly related to the query. the biological significance of the high scoring sequences may be inferred almost solely on the basis of the similarity score, while the biological context of the borderline sequences may be helpful in distinguishing biologically interesting relationships.
Recent results (Karlin & Altschul, 1990; Karlin et al., 1990) allow us to estimate the highest MSP score S at which chance similarities are likely to appear. To accelerate database searches, BLAST minimizes the time spent on sequence regions whose similarity with the query has little chance of exceeding this score. Let a word pair be a segment pair of fixed length w. The main strategy of BLAST is to seek only segment pairs that contain a word pair with a score of at least T. Scanning through a sequence, one can determine quickly whether it contains a word of length w that can pair with the query sequence to produce a word pair with a score greater than or equal to the threshold T. Any such hit is extended to determine if it is contained within a segment pair whose score is greater than or equal to S. The lower the threshold T, the greater the chance that a segment pair with a score of at least S will contain a word pair with a score of at least T. A small value for T, however, increases the number of hits and therefore the execution time of the algorithm. Random simulation permits us to select a threshold T that balances these considerations.
(c) Implementation
In our implementations of this approach, details of the 3 algorithmic steps (namely compiling a list of high-scoring words, scanning the database for hits, and extending hits) vary somewhat depending on whether the database contains proteins or DNA sequences. For proteins, the list consists of all words (w-mers) that score at least T when compared to some word in the query sequence. Thus, a query word may be represented by no words in the list (e.g. for common w-mers using PAM-120 scores) or by many. (One may, of course, insist that every w-mer in the query sequence be included in the word list, irrespective of whether pairing the word with itself yields a score of a least T.) For values of w and T that we have found most useful (see below), there are typically of the order of 50 words in the list for every residue in the query sequence, e.g. 12,500 words for a sequence of length 250. If a little care is taken in programming, the list of words can be generated in time essentially proportional to the length of the list.
The scanning phase raised a classic algorithmic problem, i.e. search a long sequence for all occurrences of certain short sequences. We investigated 2 approaches. Simplified, the first works as follows. suppose that w = 4 and map each word to an integer between 1 and 204, so a word can be used as an index into an array of size 204 = 160,000. Let the ith entry of such an array point to the list of all occurrences in the query sequence of the ith word. Thus, as we scan the database, each database word leads us immediately to the corresponding hits. Typically, only a few thousand of the 204 possible words will be in this table, and it is easy to modify the approach to use far fewer than 204 pointers.
The second approach we explored for the scanning phase was the use of a deterministic finite automaton or finite state machine (Mealy, 1955; Hopcroft & Ullman, 1979). An important feature of our construction was to signal acceptance on transitions (Mealy paradigm) as opposed to on states (Moore paradigm). In the automaton’s construction, this saved a factor in space and time roughly proportional to the size of the underlying alphabet. This method yielded a program that ran faster and we prefer this approach for general use. With typical query lengths and parameter settings, this version of BLAST scans a protein database at approximately 500,00 residues/s.
Extending a hit to find a locally maximal segment pair containing that hit is straightforward. To economize time, we terminate the process of extending in one direction when we reach a segment pair whose score falls a certain distance below the best score found for shorter extensions. This introduces a further departure from the ideal of finding guaranteed MSPs, but the added inaccuracy is negligible, as can be demonstrated by both experiment and analysis (e.g. for protein comparisons the default distance is 20, and the probability of missing a higher scoring extension is about 0.001).
For DNA, we use a simpler word list, i.e. the list of all contiguous w-mers in the query sequence, often with w = 12. Thus, a query sequence of length n yields a list of n-w+1 words, and again there are commonly a few thousand words in the list. It is advantageous to compress the database by packing 4 nucleotides into a single byte, using an auxiliary table to delimit the boundaries between adjacent sequences. Assuming w ≥ 11, each hit must contain an 8-mer hit that lies on a byte boundary. This observation allows us to scan the database byte-wise and thereby increase speed 4-fold. For each 8-mer hit, we check for an enclosing w-mer hit; if found, we extend as before. Running on a SUN4, with a query of typical length (e.g. several thousand bases), BLAST scans at approximately 2 x 10⁶ bases/s. At facilities which run many such searches a day, loading the compressed database into memory once in a shared memory scheme affords substantial saving in subsequent search times.
It should be noted that DNA sequences are highly non-random, with locally biased base composition (e.g. A+T-rich regions), and repeated sequence elements (e.g. Alu sequences) and this has important consequences for the design of a DNA database search tool. If a given query sequence has, for example, an A+T-rich subsequence, or a commonly occurring repetitive element, then a database search will produce a copious output of matches with little interest. We have designed a somewhat ad hoc but effective means of dealing with these 2 problems. The program that produces the compressed version of the DNA database tabulates the frequencies of all 8-tuples. Those occurring much more frequently than expected by chance (controllable by parameter) are stored and used to filter “uninformative” words from the query word list. Also, preceding full database searches, a search of a sublibrary of repetitive elements is performed, and the locations in the query of significant matches are stored. Words generated by these regions are removed from the query word list for the full search. Matches to the sublibrary, however, are reported in the final output. These 2 filters allow alignments to regions with biased composition, or to regions containing repetitive elements to be reported, as long as adjacent regions not containing such features share significant similarity to the query sequence.
The BLAST strategy admits numerous variations. We implemented a version of BLAST that uses dynamic programming to extend hits so as to allow gaps in the resulting alignments. Needless to say, this greatly slows the extension process. While the sensitivity of amino acid searches was improved in some cases, the selectivity was reduced as well. Given the trade-off of speed and selectivity for sensitivity, it is questionable whether the gap version of BLAST constitutes an improvement. We also implemented the alternative of making a table of all occurrences of the w-mers in the database, then scanning the query sequence and processing hits. The disk space requirements are considerable, approximately 2 computer words for every residue in the database. More damaging was that for query sequences of typical length, the need for random access into the database (as opposed to sequential access) made the approach slower, on the computer systems we used, than scanning the entire database.
3. Results
To evaluate the utility of our method, we describe theoretical results about the statistical significance of MSP scores, study the accuracy of the algorithm for random sequences at approximating MSP scores, compare the performance of the approximation to the full calculation on a set of related protein sequences and, finally, demonstrate its performance comparing long DNA sequences.
(a) Performance of BLAST with random sequences
Theoretical results on the distribution of MSP scores from the comparison of random sequences have recently become available (Karlin & Altschul, 1990; Karlin et al., 1990). In brief, given a set of probabilities for the occurrence of individual residues, and a set of scores for aligning pairs of residues, the theory provides two parameters λ and K for evaluating the statistical significance of MSP scores. When two random sequences of lengths m and n are compared, the probability of finding a segment pair with a score greater than or equal to S is:
| 1−e−y, | (1) |
where y = Kmne-λS. More generally, the probability of finding c or more distinct segment pairs, all with a score of at least S, is given by the formula:
| 1−e−y |
|
|
. | (2) |
Using this formula, two sequences that share several distinct regions of similarity can sometimes be detected as significantly related, even when no segment pair is statistically significant in isolation.
While finding an MSP with a p-value of 0.001 may be surprising when two specific sequences are compared, searching a database of 10,000 sequences for similarity to a query sequence is likely to turn up ten such segment pairs simply by chance. Segment pair p-values must be discounted accordingly when the similar segments are discovered through blind database searches. Using formula (1), we can calculate the approximate score an MSP must have to be distinguishable from chance similarities found in a database.
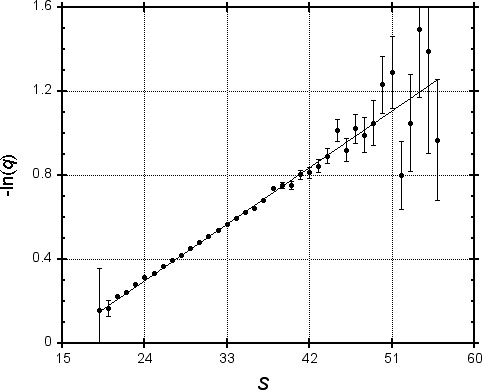
We are interested in finding only segment pairs with a score above some cutoff S. The central idea of the BLAST algorithm is to confine attention to segment pairs that contain a word pair of length w with a score of at least T. It is therefore of interest to know what proportion of segment pairs with a given score contain such a word pair. This question makes sense only in the context of some distribution of high-scoring segment pairs. For MSPs arising from the comparison of random sequences, Dembo & Karlin (1991) provide such a limiting distribution. Theory does not yet exist to calculate the probability q that such a segment pair will fail to contain a word pair with a score of at least T. However, one argument suggests that q should depend exponentially upon the score of the MSP. Because the frequencies of paired letters in MSPs approaches a limiting distribution (Karlin & Altschul, 1990), the expected length of an MSP grows linearly with its score. Therefore, the longer an MSP, the more independent chances it effectively has for containing a word with a score of at least T, implying that q should decrease exponentially with increasing MSP score S.
To test this idea, we generated one million pairs of “random protein sequences” (using typical amino acid frequencies) of length 250, and found the MSP for each using PAM-120 scores. In Figure 1, we plot the logarithm of the fraction q of MSPs with score S that do not contain a word pair of length four with score at least 18. Since the values shown are subject to statistical variation, error bars represent one standard deviation. A regression line is plotted, allowing for heteroscedasticity (differing degrees of accuracy of the y-values). The correlation coefficient for -ln(q) and S is 0.999, suggesting that for practical purposes our model of the exponential dependence of q upon S is valid.
We repeated this analysis for a variety of word lengths and associated values of T. Table 1 shows the regression parameters a and b found for each instance; the correlation was always greater than 0.995. Table 1 also shows the implied percentage q = e-(aS+b) of MSPs with various scores that would be missed by the BLAST algorithm. These numbers are of course properly applicable only to chance MSPs. However, using a log-odds score matrix such as the PAM-120 that is based upon empirical studies of homologous proteins, high-scoring chance MSPs should resemble MSPs that reflect true homology (Karlin & Altschul, 1990). Therefore, Table 1 should provide a rough guide to the performance of BLAST on homologous as well as chance MSPs.
Based on the results of Karlin et al. (1990), Table 1 also shows the expected number of MSPs found when searching a random database of 16,000 length 250 protein sequences with a length 250 query. (These numbers were chosen to approximate the current size of the PIR database and the length of an average protein.) As seen from Table 1, only MSPs with a score over 55 are likely to be distinguishable from chance similarities. With w = 4 and T = 17, BLAST should miss only about a fifth of the MSPs with this score, and only about a tenth of MSPs with a score near 70. We will consider below the algorithm’s performance on real data.
(b) The choice of word length and threshold parameters
On what basis do we choose the particular setting of the parameters w and T for executing BLAST on real data? We begin by considering the word length w.
The time required to execute BLAST is the sum of the times required (1) to compile a list of words that can score at least T when compared with words from the query; (2) to scan the database for hits (i.e. matches to words on this list); and (3) to extend all hits to seek segment pairs with scores exceeding the cutoff. The time for the last of these tasks is proportional to the number of hits, which clearly depends on the parameters w and T. given a random protein model and a set of substitution scores, it is simple to calculate the probability that two random words of length w will have a score of at least T, i.e. the probability of a hit arising from an arbitrary pair of words in the query and the database. Using the random model and scores of the previous section, we have calculated these probabilities for a variety of parameter choices and recorded them in Table 1. For a given level of sensitivity (chance of missing an MSP), one can ask what choice of w minimizes the chance of a hit. Examining Table 1, it is apparent that the parameter pairs (w = 3, T = 14), (w = 4, T = 16) and (w = 5, T = 18) all have approximately equivalent sensitivity over the relevant range of cutoff scores. The probability of a hit yielded by these parameter pairs is seen to decrease for increasing w; the same also holds for different levels of sensitivity. This makes intuitive sense, for the longer the word pair examined the more information gained about potential MSPs. Maintaining a given level of sensitivity, we can therefore decrease the time spent on step (3), above, by increasing the parameter w. However, there are complementary problems created by large w. For proteins there are 20w possible words of length w, and for a given level of sensitivity the number of words generated by a query grows exponentially with w. (For example, using the 3 parameter pairs above, a 30 residue sequence was found to generate word lists of size 296, 3561 and 40,939 respectively.) This increases the time spent on step (1), and the amount of memory required. In practice, we have found that for protein searches the best compromise between these considerations is with a word size of four; this is the parameter setting we use in all analyses that follow.
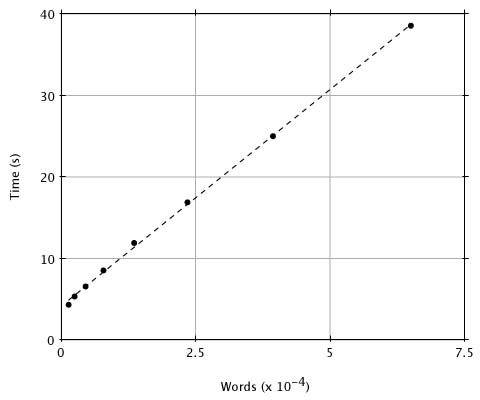
Although reducing the threshold T improves the approximation of MSP scores by BLAST, it also increases execution time because there will be more words generated by the query sequence and therefore more hits. What value of T provides a reasonable compromise between the considerations of sensitivity and time? To provide numerical data, we compared a random 250 residue sequence against the entire PIR database (Release 23.0, 14,372 entries and 3,977,903 residues) with T ranging from 20 to 13. In Figure 2 we plot the execution time (user time on a SUN4-280) versus the number of words generated for each value of T. Although there is a linear relationship between the number of words generated and execution time, the number of words generated increases exponentially with decreasing T over this range (as seen by the spacing of x values). This plot and a simple analysis reveal that the expected-time computational complexity of BLAST is approximately aW + bN + cNW/20w, where W is the number of words generated, N is the number of residues in the database and a, b and c are constants. The W term accounts for compiling the word list, the N term covers the database scan, and the NW term is for extending the hits. Although the number of words generated, W, increases exponentially with decreasing T, it increases only linearly with the length of the query, so that doubling the query length doubles the number of words. We have found in practice that T = 17 is a good choice for the threshold because, as discussed below, lowering the parameter further provides little improvement in the detection of actual homologies.
BLAST’s direct tradeoff between accuracy and speed is best illustrated by Table 2. Given a specific probability q of missing a chance MSP with score S, one can calculate what threshold parameter T is required, and therefore the approximate execution time. Combining the data of Table 1 and Figure 2, Table 2 shows the central processing unit times required (for various values of q and S) to search the current PIR database with a random query sequence of length 250. To have about a 10% chance of missing an MSP with the statistically significant score of 70 requires about nine seconds of central processing unit time. To reduce the chance of missing such an MSP to 2% involves lowering T, thereby doubling the execution time. Table 2 illustrates, furthermore, that the higher scoring (and more statistically significant) an MSP, the less time is required to find it with a given degree of certainty.
(c) Performance of BLAST with homologous sequences
To study the performance of BLAST on real data, we compared a variety of proteins with other members of their respective superfamilies (Dayhoff, 1978), computing the true MSP scores as well as the BLAST approximation with word length four and various settings of the parameter T. Only with superfamilies containing many distantly related proteins could we obtain results usefully comparable with the random model of the previous section. Searching the globins with woolly monkey myoglobin (PIR code MYMQW), we found 178 sequences containing MSPs with scores between 50 and 80. Using word length four and T parameter 17, the random model suggests BLAST should miss about 24 of these MSPs; in fact, it misses 43. This poorer than expected performance is due to the uniform pattern of conservation in the globins, resulting in a relatively small number of high-scoring words between distantly related proteins. A contrary example was provided by comparing the mouse immunoglobulin κ chain precursor V region (PIR code KVMST1) with immunoglobulin sequences, using the same parameters as previously. Of the 33 MSPs with scores between 45 and 65, BLAST missed only two; the random model suggests it should have missed eight. In general, the distribution of mutations along sequences has been shown to be more clustered than predicted by a Poisson process (Uzzell & Corbin, 1971), and thus the BLAST approximation should, on average, perform better on real sequences than predicted by the random model.
BLAST’s great utility is for finding high-scoring MSPs quickly. In the examples above, the algorithm found all but one of the 89 globin MSPs with a score over 80, and all of the 125 immunoglobulin MSPs with a score over 50. The overall performance of BLAST depends upon the distribution of MSP scores for those sequences related to the query. In many instances, the bulk of the MSPs that are distinguishable from chance have a high enough score to be found readily by BLAST, even using relatively high values of the T parameter. Table 3 shows the number of MSPs with a score above a given threshold found by BLAST when searching a variety of superfamilies using a variety of T parameters. In each instance, the threshold S is chosen to include scores in the borderline region, which in a full database search would include chance similarities as well as biologically significant relationships. Even with T equal to 18, virtually all the statistically significant MSPs are found in most instances.
Comparing BLAST (with parameters w = 4, T = 17) to the widely used FASTP program (Lipman & Pearson, 1985; Pearson & Lipman, 1988) in its most sensitive mode (ktup = 1), we have found that BLAST is of comparable sensitivity, generally yields fewer false positives (high-scoring but unrelated matches to the query), and is over an order of magnitude faster.
(d) Comparison of two long DNA sequences
Sequence data exist for a 73,360 bp section of the human genome containing the β-like globin gene cluster and for a corresponding 44,595 bp section of the rabbit genome (Margot et al., 1989). The pair exhibits three main classes of locally similar regions, namely genes, long interspersed repeats and certain anticipated weaker similarities, as described below. We used the BLAST algorithm to locate locally similar regions that can be aligned without introduction of gaps.
The human gene cluster contains six globin genes, denoted ε, Gγ, Aγ, η, δ and β, while the rabbit cluster has only four, namely, ε, γ, δ and β. (Actually, rabbit δ is a pseudogene.) Each of the 24 gene pairs, one human gene and one rabbit gene, constitutes a similar pair. An alignment of such a pair requires insertion and deletions, since the three exons of one gene generally differ somewhat in their lengths from the corresponding exons of the paired gene, and there are even more extensive variations among the introns. Thus, a collection of the highest scoring alignments between similar regions can be expected to have at least 24 alignments between gene pairs.
Mammalian genomes contain large numbers of long interspersed repeat sequences, abbreviated LINES. In particular, the human β-like globin cluster contains two overlapped L1 sequences (a type of LINE) and the rabbit cluster has two tandem L1 sequences in the same orientation, both around 6000 bp in length. These human and rabbit L1 sequences are quite similar and their lengths make them highly visible in similarity computations. In all, eight L1 sequences have been cited in the human cluster and five in the rabbit cluster, but because of their reduced length and/or reversed orientation, the other published L1 sequences do not affect the results discussed below. Very recently, another piece of an L1 sequence has been discovered in the rabbit cluster (Huang et al., 1990).
Evolution theory suggests that an ancestral gene cluster arranged as 5’-ε-γ-η-δ-β-3’ may have existed before the mammalian radiation. Consistent with this hypothesis, there are inter-gene similarities within the β clusters. For example, there is a region between human ε and Gγ that is similar to a region between rabbit ε and γ.
We applied a variant of the BLAST programs to these two sequences, with match score 5, mismatch score −4 and, initially, w = 12. The program found 98 alignments scoring over 200, with 1301 being the highest score. Of the 57 alignments scoring over 350, 45 paired genes (with each of the 24 possible gene pairs represented) and the remaining 12 involved L1 sequences. Below 350, inter-gene similarities (as described above) appear, along with additional alignments of genes and of L1 sequences. Two alignments with scores between 200 and 350 do not fit the anticipated pattern. One reveals the newly discovered section of L1 sequence. The other aligns a region immediately 5’ from the human β gene with a region just 5’ from rabbit δ. This last alignment may be the result of an intrachromosomal gene conversion between δ and β in the rabbit genome (Hardison & Margot, 1984).
With smaller values of w, more alignments are found. In particular, with w = 8, an additional 32 alignments are found with a score above 200. All of these fall in one of the three classes discussed above. Thus, use of a smaller w provides no essentially new information. The dependence of various values on w is given in Table 4. Time is measured in seconds on a SUN4 for a simple variant of BLAST that works with uncompressed DNA sequences.
4. Conclusion
References
|
| ||||||||||||
| w | T |
Probability of a
hit x 105 |
Linear regression
−ln(q) = aS + b |
Implied % of MSPs missed by BLAST when S equals
| ||||||||
|---|---|---|---|---|---|---|---|---|---|---|---|---|
| a | b | 45 | 50 | 55 | 60 | 65 | 70 | 75 | ||||
|
| ||||||||||||
| 3 | 11 | 253 | 0.1236 | −1.005 | 1 | 1 | 0 | 0 | 0 | 0 | 0 | |
| 12 | 147 | 0.0875 | −0.746 | 4 | 3 | 2 | 1 | 1 | 0 | 0 | ||
| 13 | 83 | 0.0625 | −0.570 | 11 | 8 | 6 | 4 | 3 | 2 | 2 | ||
| 14 | 48 | 0.0463 | −0.461 | 20 | 16 | 12 | 10 | 8 | 6 | 5 | ||
| 15 | 26 | 0.0328 | −0.353 | 33 | 28 | 23 | 20 | 17 | 14 | 12 | ||
| 16 | 14 | 0.0232 | −0.263 | 46 | 41 | 36 | 32 | 29 | 26 | 23 | ||
| 17 | 7 | 0.0158 | −0.191 | 59 | 55 | 51 | 47 | 43 | 40 | 37 | ||
| 18 | 4 | 0.0109 | −0.137 | 70 | 67 | 63 | 60 | 57 | 54 | 51 | ||
| 4 | 13 | 127 | 0.1192 | −1.278 | 2 | 1 | 1 | 0 | 0 | 0 | 0 | |
| 14 | 78 | 0.0904 | −1.012 | 5 | 3 | 2 | 1 | 1 | 0 | 0 | ||
| 15 | 47 | 0.0686 | −0.802 | 10 | 7 | 5 | 4 | 3 | 2 | 1 | ||
| 16 | 28 | 0.0519 | −0.634 | 18 | 14 | 11 | 8 | 6 | 5 | 4 | ||
| 17 | 16 | 0.0390 | −0.498 | 28 | 23 | 19 | 16 | 13 | 11 | 9 | ||
| 18 | 9 | 0.0290 | −0.387 | 40 | 35 | 30 | 26 | 22 | 19 | 17 | ||
| 19 | 5 | 0.0215 | −0.298 | 51 | 46 | 41 | 37 | 33 | 30 | 27 | ||
| 20 | 3 | 0.0159 | −0.234 | 62 | 57 | 53 | 49 | 45 | 41 | 38 | ||
| 5 | 15 | 64 | 0.1137 | −1.525 | 3 | 2 | 1 | 1 | 0 | 0 | 0 | |
| 16 | 40 | 0.0882 | −1.207 | 6 | 4 | 3 | 2 | 1 | 1 | 0 | ||
| 17 | 25 | 0.0679 | −0.939 | 12 | 9 | 6 | 4 | 3 | 2 | 2 | ||
| 18 | 15 | 0.0529 | −0.754 | 20 | 15 | 12 | 9 | 7 | 5 | 4 | ||
| 19 | 9 | 0.0413 | −0.608 | 29 | 23 | 19 | 15 | 13 | 10 | 8 | ||
| 20 | 5 | 0.0327 | −0.506 | 38 | 32 | 28 | 23 | 20 | 17 | 14 | ||
| 21 | 3 | 0.0257 | −0.420 | 48 | 42 | 37 | 32 | 29 | 25 | 22 | ||
| 22 | 2 | 0.0200 | −0.343 | 57 | 52 | 47 | 42 | 38 | 35 | 31 | ||
| Expected no. of random MSPs with score at least S: | 50 | 9 | 2 | 0.3 | 0.06 | 0.01 | 0.002 | |||||
|
| ||||||||||||
|
| |||||
| q (%) | CPU time (s) | ||||
|---|---|---|---|---|---|
|
| |||||
| 2 | 39 | 25 | 17 | 12 | |
| 5 | 25 | 17 | 12 | 9 | |
| 10 | 17 | 12 | 9 | 7 | |
| 20 | 12 | 9 | 7 | 5 | |
| S: | 44 | 55 | 70 | 90 | |
| p-value | 1.0 | 0.8 | 0.01 | 10−5 | |
|
| |||||
| Times are for searching the PIR database (Release 23.0) with a random query sequence of length 250 using a SUN4-280. CPU, central processing unit. | |||||
|
| ||||||||||||
|
PIR code of
query sequence |
Superfamily
searched |
Cutoff
score S |
Number of MSPs with score at least S
found by BLAST with T parameter set to |
Number of MSPs
in superfamily with score at least S | ||||||||
|---|---|---|---|---|---|---|---|---|---|---|---|---|
| 22 | 20 | 19 | 18 | 17 | 16 | 15 | ||||||
| MYMQW, woolly monkey myoglobin; KVMST1, mouse Ig κ chain precursor V region; OKBOG, bovine cGMP-dependent protein kinase; ITHU, human α-1-antitrypsin precursor; KYBOA, bovine chymotrypsinogen A; CCHU, human cytochrome c; FECF, Chlorobium sp. ferredoxin. | ||||||||||||
|
| ||||||||||||
| MYMQW | Globin | 47 | 115 | 169 | 178 | 222 | 238 | 255 | 281 | 285 | ||
| KVMST1 | Immunoglobulin | 47 | 153 | 155 | 155 | 156 | 156 | 157 | 158 | 158 | ||
| OKBOG | Protein kinase | 52 | 9 | 42 | 47 | 59 | 60 | 60 | 60 | 60 | ||
| ITHU | Serpin | 50 | 12 | 12 | 12 | 12 | 12 | 12 | 12 | 12 | ||
| KYBOA | Serine protease | 49 | 59 | 59 | 59 | 59 | 59 | 59 | 59 | 59 | ||
| CCHU | Cytochrome c | 46 | 81 | 91 | 91 | 96 | 98 | 98 | 98 | 98 | ||
| FECF | Ferredoxin | 44 | 22 | 23 | 23 | 24 | 24 | 24 | 24 | 24 | ||
|
|
||||||||||||
|
| |||||
| w | Time | Words | Hits | Matches | |
|---|---|---|---|---|---|
|
| |||||
| 8 | 15.9 | 44,587 | 118,941 | 130 | |
| 9 | 6.8 | 44,586 | 39,218 | 123 | |
| 10 | 4.3 | 44,585 | 15,321 | 114 | |
| 11 | 3.5 | 44,584 | 7345 | 106 | |
| 12 | 3.2 | 44,583 | 4197 | 98 | |
|
| |||||